|
Download as PDF
Highlights of the 2018 Medicare Shared Savings Program Results
The Medicare Shared Savings Program (MSSP), Medicare’s largest value-based payment program, experienced its best year to date in 2018, generating its highest savings with sustained quality. In 2018, 548 ACOs cared for 10.1 million beneficiaries in MSSP. The results prove the accountable care model is successful when participating providers (1) are given time to implement changes within their organizations, (2) are provided necessary tools and data to engage patients and understand care patterns, and (3) policymakers offer an appropriate balance of risk and reward. These 2018 results should tell policymakers and organizations both in and outside of ACOs that payment and delivery models that make providers accountable for patients’ total-cost-of-care provide tremendous value, and that we need to consider ways to sustain MSSP’s growth and build upon results we’ve already seen. This document includes highlights of the Centers for Medicare & Medicaid Services (CMS) results available in this public use file, which are based on data related to financial benchmarks and quality scores.
Key Findings from the 2018 MSSP Results
- ACOs generated savings of $1.7 billion compared to their benchmarks.
- Medicare saved $740 million after accounting for shared savings payments and collecting shared loss payments.
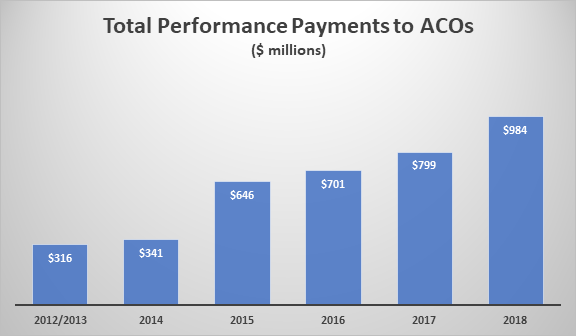
- ACOs earned $984 million in shared savings payments, as shown in graphic 1.
- ACOs generated $169 in savings per beneficiary compared to their benchmark.
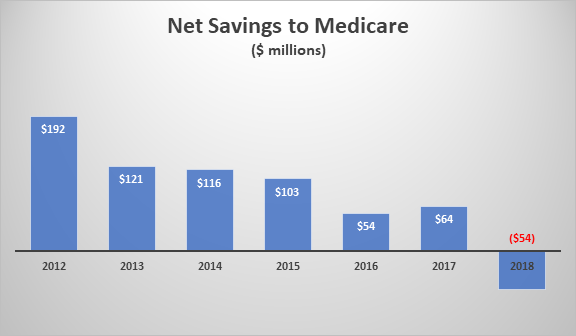
- For the second year in a row, MSSP generated net savings to Medicare after accounting for shared savings payments.
- Eleven ACOs shared losses paying a combined $17.6 million.0
Graphic 1: Amounts of shared savings payments paid to ACOs for each performance year
ACOs continue to provide high-quality care and improve quality over time
- ACOs subject to pay-for-performance measures earned an average quality score of 92.91 percent in 2018.
- ACOs that joined the program in 2016 or 2017 improved their quality measure performance by an average of 27 percent in 2018, according to a Health Affairs blog from CMS Administrator Seema Verma.
- 124 ACOs received a perfect quality score in 2018.
- 93 percent of ACOs participating in both 2017 and 2018 received bonus points for quality performance improvement.
- All but two ACOs met the Quality Performance Standard, which is required for eligible ACOs to retain a portion of the savings they generate.
Common traits of ACOs that shared in savings
- According to data from this October 24 CMS presentation, ACOs that shared in savings showed declines in emergency department visits (4.0 percent), skilled nursing facility (SNF) utilization days (16.8 percent), and hospital inpatient spending (3.4 percent). ACOs that had shared losses had increases in these categories.
- Part B spending and outpatient spending grew (5.6 and 13.5 percent) for ACOs that generated shared savings, but those increases were lower (10.4 and 18.9 percent) than ACOs that had shared losses.
- Post-acute spending and use dropped in ACOs that generated savings and increased for ACOs that shared in losses.
Achieving success takes time – sometimes years of work
- As we’ve seen in the past, ACOs who’ve participated in MSSP longer have a better chance of success.
- 59 percent of ACOs who started in 2012 or 2013 earned shared savings in 2018, compared to 26 percent who were either in their first or second year. Table 1 shows the percent of ACOs that earned shared savings by their start year.
- ACOs in their second contract period (N=243) generally saved more than twice as much per beneficiary compared to ACOs in their initial contract period (N=305).
Table 1: The percent of ACOs that earned shared savings by their start year
|
Start Year
|
Number of ACOs
|
PY 2013
|
PY 2014
|
PY 2015
|
PY 2016
|
PY 2017
|
PY 2018
|
|
2012
|
58
|
32%
|
37%
|
42%
|
42%
|
51%
|
57%
|
|
2013
|
49
|
21%
|
27%
|
37%
|
36%
|
44%
|
61%
|
|
2014
|
73
|
N/A
|
19%
|
22%
|
36%
|
43%
|
47%
|
|
2015
|
65
|
N/A
|
N/A
|
21%
|
26%
|
28%
|
23%
|
|
2016
|
91
|
N/A
|
N/A
|
N/A
|
18%
|
29%
|
42%
|
|
2017
|
89
|
N/A
|
N/A
|
N/A
|
N/A
|
21%
|
33%
|
|
2018
|
123
|
N/A
|
N/A
|
N/A
|
N/A
|
N/A
|
21%
|
Graphic 2: Net savings to Medicare in 2018 broken down by the year an ACO entered MSSP
- More ACOs are generating savings and sharing in savings.
- 66 percent of ACOs saved Medicare money, and 37 percent saved enough to earn shared savings, as shown in graphic 3. Both of these numbers are new highs for MSSP.
Graphic 3: The percent of ACOs that generated savings and earned shared savings
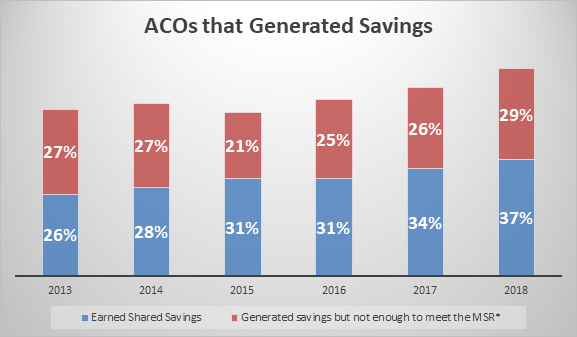
*The MSR is the Minimum Savings Rate. It’s the level of savings that must be generated before an ACO can share in savings with CMS.
Track 1+ ACOs had successful first year
- 2018 was the first year Track 1+ was available. Fifty-two ACOs participated in the track that offered a more gradual risk taking. NAACOS worked closely with CMS on the development of Track 1+ and was very pleased to see strong participation in the initial year.
- 63 percent of Track 1+ ACOs earned shared savings, compared to 32 percent of Track 1 ACOs and 56 percent of Track 3s.
- There were seven Track 2 ACOs in 2018, and six earned shared savings.
Experienced high revenue ACOs generated savings
- CMS cites data that low revenue ACOs outperform high revenue ACOs and therefore should move to risk faster where chances of generating savings are greater. But 2018 data show high revenue ACOs still generate savings when given time.
- Both high and low revenue ACOs in their second contract outperformed ACOs in their first contract period, generating almost twice as much savings per beneficiary.
- 58 percent of the 313 high revenue ACOs generated savings compared to their benchmark.
- High revenue ACOs generated $132 million in net savings to Medicare in 2018.
Counterfactual savings should be considered
Comparing ACO performance to CMS-set benchmarks is only one way to judge ACO results, and NAACOS feels comparing savings to Medicare spending in the absence of ACOs is another important measure. This so-called “counterfactual” or difference-in-difference analysis is more difficult because it requires comparing ACO providers and patients to a comparable set of non-ACO providers and patients. Historically, these types of analyses have been limited, but data using this method is growing. The Medicare Payment Advisory Commission used the analysis to find MSSP has lowered Medicare spending by 1 percent to 2 percent after shared-savings payments earned by ACOs, which translates into tens of billions of dollars when compounded annually. An independent analysis commissioned by NAACOS and conducted last year by a health economics and policy consulting firm showed $2.7 billion in overall savings and more than $660 million in net savings, after paying shared savings to ACOs. A 2018 peer-reviewed paper by Harvard researchers published in the New England Journal of Medicine found that in 2015 the MSSP generated gross savings of $704 million and reduced Medicare spending by $145 million after accounting for shared-savings payments earned by ACOs.
NAACOS-member ACOs outperformed non-NAACOS members
Table 2: Comparison on NAACOS-member ACOs and non-members in key categories
|
|
Number of ACOs
|
Mean Savings per Beneficiary
|
Net Savings to Medicare
|
Average Quality Score
|
|
NAACOS Members
|
296
|
$ 186.35
|
$ 582,997,035
|
93.61%
|
|
Non-Members
|
252
|
$ 143.55
|
$ 383,397,351
|
92.08%
|
Conclusion
In 2018, the MSSP saved Medicare $740 million and generated net savings to Medicare for the second year in a row. ACOs saved an average of $169 for each of the 10.1 million beneficiaries cared for. These record savings don’t include Next Generation ACO Model savings. This demonstrates continued improvement of ACOs. As policymakers search for ways to lower health spending, they should look to support and expand ACOs and other population-health models that make providers accountable for the total-cost-of-care.
|