- Home
- About Us
- Membership
- Partners
- Resources
- Education & Events
- Advocacy
- Advocacy Letters
- COVID-19
- Shared Savings Program
- Medicaid ACOs
- CMMI Models
- ACO Program Elements
- Quality and Equity
- Congress
- Payment Rules
- Other Regulations
- News
- ACO News
- NAACOS Blog
- NAACOS In the News
- NAACOS Member News
- Press Releases & Letters
|
Download the full report
Estimates of Savings by Medicare Shared Savings Program ACOs
Program Financial Performance 2013-2015 Submitted by: Dobson|DaVanzo Allen Dobson, Ph.D. Sarmistha Pal, Ph.D. Alex Hartzman, M.P.A., M.P.H. Luis Arzaluz, M.S. Kimberly Rhodes, M.A. Joan E. DaVanzo, Ph.D., M.S.W. Thursday, August 30, 2018 — Final Report Table of Contents Executive Summary
Executive Summary For too many patients, the U.S. health care system provides inconsistent quality and fragmented care that costs too much. Most health policy experts agree that moving away from fee-for-service (FFS) payment that rewards volume and toward value-based payment that rewards providers for improving outcomes and controlling cost is essential for improving the health care system’s performance. The Accountable Care Organization (ACO) model is a market-based solution to fragmented and costly care that begins to align financial incentives to encourage local physicians, hospitals, and other providers to work together and take responsibility for improving quality, reducing waste to help keep care affordable, and enhancing patient experience. The Medicare Shared Savings Program (MSSP) is the largest value-based payment model in the country with 561 ACOs covering 10.5 million Medicare beneficiaries. 1 The MSSP creates incentives for ACOs to improve care by allowing them to share savings they generate by achieving defined quality and cost goals. The program allows ACOs to gradually take on financial risk for managing spending growth. Such an approach gives ACOs time to build the infrastructure—the care coordination, information technology, and data analytics capabilities—to transform practice and manage risk successfully. Evidence shows that MSSP ACOs collectively have measurably improved quality and saved Medicare money. 2 At the same time, Medicare beneficiaries attributed to ACOs maintain total choice in seeing any Medicare provider they want. ACOs also are slowing cost growth more broadly in local health care markets through spillover effects in changing care delivery for patients not included in ACOs. 3 However, there is disagreement about the degree of savings achieved by ACOs participating in the MSSP. The Centers for Medicare & Medicaid Services (CMS) calculates savings based on a benchmarking methodology where actual spending is compared with targets based on each ACO’s historical spending trended forward using the national average rate of growth in Medicare spending per beneficiary. Researchers have found that this method systematically understates the actual savings generated by MSSP ACOs. 4 The Medicare Payment Advisory Commission (MedPAC), for example, concluded that ACOs may have saved the Medicare program up to 2 percent more than indicated by the benchmarking methodology based on studies using comparison groups. 5 Dobson | DaVanzo & Associates was commissioned by the National Association of Accountable Care Organizations (NAACOS) to conduct an independent evaluation of MSSP ACO cost savings. We estimate that ACOs in the MSSP generated savings of $1.84 billion during performance years 2013-2015, or nearly twice the $954 million in savings estimated by the CMS benchmarking methodology. Further, we found that the MSSP generated net savings of $541.7 million from 2013-2015 after accounting for shared savings bonuses earned by ACOs (Exhibit ES- 1). Exhibit ES-1: Net Federal Savings in the Medicare Shared Savings Program for 2013-2015: Dobson | DaVanzo Analysis versus CMS Benchmark Methodology
Source: Dobson | DaVanzo analysis of ACO RIF Data, CMS DUA 28643 and CMS MSSP Public Use Files, 2013-2015 Our study used a difference-in-differences regression analysis—the gold standard for program evaluation—and found savings similar to other independent research studies. 6,7 Based on Medicare FFS claims data from 2011-2015, the analytic sample included claims for 100 percent of ACO- attributed beneficiaries and a comparison group of roughly 90 percent of Medicare FFS beneficiaries who were eligible to be assigned to an ACO but were not assigned because they did not receive a majority of their care from an ACO.8 This extremely large sample with claims data for 24 million to 26 million Medicare beneficiaries per year gives the analysis substantial statistical power. In contrast, the CMS method of measuring ACO savings is based on an administrative formula to determine whether ACOs will receive shared savings. It is problematic when this financial target setting approach is used as if it were a program evaluation. Indeed, when independently evaluating both the Pioneer ACO and Next Generation ACO programs, CMS contractors used a difference-in- differences regression approach to estimate savings rather than the CMS benchmarking methodology used to set financial targets and calculate bonuses or penalties. 9,10 The CMS benchmarking methodology addresses the question “How has ACO spending changed compared to prior years’ spending?” While this may be an appropriate way to set performance benchmarks, it produces a biased estimate of program savings when compared to what may have occurred if the ACO program had not been in place. Instead, evaluation of program savings should incorporate a carefully designed comparison group or counterfactual to account for prevailing trends to address the question: “How have ACOs changed expenditures compared to providers not participating in the ACO program?” The CMS administrative payment and savings estimates do not accurately reflect ACO savings and produce incorrect inferences for policymaking. 11 Thus, it is important that external evaluators approach the question of MSSP ACO savings independently and with rigorous methods to better inform CMS, Congress, and other policymakers. Introduction The stated goal of the Medicare Shared Savings Program (MSSP) is to lower the rate of growth in healthcare spending while improving patient access to quality care.12 MSSP Accountable Care Organization (ACO) progress toward this goal of achieving savings or reducing expenditure growth has proven controversial, in part because there are a variety of ways to measure savings that may generate different results. In this report, we describe the Dobson | DaVanzo team approach13 to measuring MSSP savings and contrast this with reported findings from CMS. We also compare our results to other published work. Dobson | DaVanzo & Associates was commissioned by the National Association of Accountable Care Organizations (NAACOS) to conduct an independent evaluation of MSSP ACO cost savings. The CMS method of measuring ACO performance is based on an administrative formula that creates spending targets constructed with ACOs’ historical expenditures that are used to determine whether they will receive bonus payments. It is problematic when this financial target setting approach is used as if it were a program evaluation. Indeed, when independently evaluating both the Pioneer ACO and Next Generation ACO programs, CMS contractors used a difference-in-differences regression approach to estimate savings rather than the CMS benchmarking methodology used to set financial targets and calculate bonuses or penalties. 14,15 The CMS benchmarking methodology addresses the question “How has ACO spending changed compared to prior years’ spending?” While this may be an appropriate way to set performance benchmarks, it produces a biased estimate of program savings when compared to what may have occurred in the Medicare Fee-for-Service market had the ACO program not been in place. Instead, evaluation of program savings should incorporate a carefully designed comparison group or counterfactual to account for prevailing trends in order to address the question: “How have ACOs changed expenditures compared to other providers not participating in the ACO program?” Because the CMS administrative payment and savings estimates do not reflect “true” ACO savings, it produces incorrect inferences for use in policymaking.16 Thus, it is important that external evaluators approach the question of ACO savings independently and with rigorous methods to better inform CMS, Congress, and other policymakers. The purpose of this paper is to develop savings estimates using validated methodologies that are independent of the current CMS benchmarking approach. Methodology Analyses reported here were performed using CMS Research Identifiable Files (RIF) which contain administrative claims data for beneficiaries from 2011-2015 (CMS Data Use Agreement number 28643). The database contains claims for 100% of ACO-attributed beneficiaries and 83-94% of ACO assignable, but unattributed Medicare Fee-for-Service beneficiaries (depending on the performance year). This is a sample of 24-26 million beneficiaries per ACO performance year that allows for substantial power to conduct rigorous multivariate regression and other statistical analyses. The Dobson | DaVanzo team estimated ACO savings using a quasi-experimental as-treated study design featuring difference-in-differences (DID) regression analysis. Difference-in-differences is a common approach used in evaluation of public program performance, including CMS-funded evaluations, such as Pioneer ACOs17, Next Generation ACOs18, BPCI19, and the Medicaid 1115 Demonstration Evaluation Design Plan20. CMS has not commissioned an independent evaluation of the MSSP and there is no legislative requirement to do so. The as-treated DID analytic method requires the construction of counterfactuals to posit what system performance would have been without the ACO program for comparison to actual ACO expenditure performance. This is an as-treated design as ACO beneficiaries are only kept in the treatment group for the periods where they are assigned to an ACO. This has the advantage of capturing the experience of beneficiaries directly cared for by the ACO. In this approach, observations are made over time, before and after program implementation, for both the treatment and comparison groups. Savings are measured by analyzing the change in spending before and after the ACO performance year for ACO-attributed beneficiaries compared to beneficiaries in the same counties that were eligible for ACO participation, but unassigned. This design measures the change in expenditures over time between the two study groups. The comparison group is the pool of eligible but unattributed beneficiaries in geographic service areas with ACO assigned beneficiaries (counties of attributed beneficiary residence). Members of the comparison group are all service users but do not get the plurality of their care from an ACO affiliated clinician. We compare the observed expenditure trends of the comparison group to ACO program spending trends to estimate the difference between what was spent and what would have been spent in the absence of the ACO program. We estimate savings on a per-beneficiary per-year basis. By multiplying per-beneficiary savings by the number of person year adjusted beneficiaries we obtain total savings per year. In our regression analysis, we control for the following beneficiary characteristics:
We did not have beneficiary category eligibility by beneficiary month as used to construct MSSP benchmarks, expenditures and composite HCC scores and other measures. This was largely not problematic as regression analyses are applied at the beneficiary level, however it will have certain differences from the CMS PMPY and HCC calculation methodology (e.g. expenditure truncation and weighting procedures differ). We also controlled for spending changes across individual markets during the study by including interaction terms for Hospital Referral Region (HRR) and year. HRRs represent geographic designations based on definitions of regional tertiary care markets; there are 306 HRRs currently designated in the U.S. Econometric Model We have used linear multivariate regression model and difference-in-differences estimation methodology to estimate PMPY savings. The difference-in-differences (DID) estimator is defined as the difference in average outcome in the treatment group before and after program intervention minus the difference in average outcome in the comparison group before and after program intervention. This approach yields per member per year (PMPY) spending reduction of the treatment group compared to the comparison group (or savings estimates) due to the ACO program intervention. Summing savings across all performance years produces total savings estimates. The regression model is estimated using ordinary least squares regression and following is the general specification of the DID model: Yitc = b0 + b1 *Treatit + b2 * Aftert + b3 * Aftert *Treatit + b4 * X itc + b5 * HRR *Yeart + eit Here, Yitc is per member per year total Parts A and B expenditures for beneficiary “i” in year “t” and residing in county “c”. Treatit indicates whether individual “i” is assigned to an ACO in time period “t” or not; and Aftert is a dummy variable indicating the start of the ACO (i.e., post contract period). This ‘post’ period depends on the ACO start dates (for 2012 starter ACOs) and when beneficiaries were assigned to that ACO. For example, for an individual who is assigned to a 2012 starter ACO in 2012, the post periods are 2013, 2014, 2015 (2012 is removed from post observations as it is not an MSSP performance year). Similarly, for an individual who is assigned to an ACO in 2014, the post periods are 2014 and 2015. Here, the main coefficient of interest is the parameter estimates (β3) corresponding to the interaction terms of ACO treatment dummy and the post-intervention dummy variable. In order to get the PMPY savings estimate for each of the performance year (PY) separately, we have included three such dummy variable interaction terms in the model. More specifically, the model includes Treatit*After2013, Treatit*After2014 and Treatit*After2015, to get the PMPY savings estimates for each of the three performance years (2013, 2014 and 2015) separately. Here, each Treat dummy variable corresponding to each performance year includes exactly the same number of ACO assigned beneficiaries who exist in each of the performance year (total number of ACO beneficiary years we calculated closely matches the ACO public use file). Corresponding to those ACO assigned beneficiaries, those who were not included in the Master Beneficiary Summary File and claims level files are not included in our analysis. Overall, nearly 0.005% (PY3) to 0.006% (PY1 and PY2) of ACO assigned beneficiaries are not used in our regression analysis. Here, After2013 is a dummy variable and equals 1 if performance year is 2013 (zero otherwise). Similarly, After2014 is a dummy variable and equals 1 if performance year is 2014 (zero otherwise), and After2015 is a dummy variable and equals 1 if performance year is 2015 (zero otherwise). We would expect a negative sign corresponding to these DID main coefficient of interest (i.e., the interaction between the “Treat”dummy and “After”dummy variables) if the program generates any savings. The vector Xitc includes all beneficiary level demographic information (age, gender, race, and Medicare dual eligibility), health status or severity of individuals (HCC scores), as well as the original reason for beneficiary Medicare eligibility, i.e. End Stage Renal Disease (ESRD), disability. The coefficients corresponding to HRR with year interaction determine the difference in average PMPY spending for an HRR from the omitted HRR. This includes fixed effects for each hospital referral region (HRR) in each year to compare each beneficiary attributed to an ACO with beneficiaries in the control group living in the same area and to adjust for HRR-specific changes in spending or quality occurring in the control group. In order to get the total savings estimates, we have multiplied these difference-in-differences coefficients with the number of ACO assigned beneficiaries (person year adjusted) in each respective performance year. The total number of ACO beneficiary years we calculated from our RIF data closely matches results from the ACO public use file. The appendix further describes database and measure construction. We also conducted sensitivity tests and robust error estimation, available on request. Study Population Demographics Table 1 shows the treatment and comparison group makeups for each assignment year. We found that demographics in treatment and comparison groups are highly similar in each pre-contract, pre-performance and performance year. Table 1: Study Sample Demographics
Source: Dobson | DaVanzo analysis of ACO RIF Data, CMS DUA 28643 Study Findings After adjusting for geography, patient demographic factors, and HCC risk scores, we found that MSSP ACOs had significant per member per year (PMPY) savings for each performance year, 2013-2015, compared to comparison group spending. Regression Results Table 2 shows regression adjusted difference-in-differences estimation results for the MSSP ACOs during the three performance years. Table 2: Difference-in-Differences Regression Estimation of PMPY Spending Reduction (Savings) From ACOs vs. Comparison Group
Source: Dobson | DaVanzo analysis of ACO RIF Data, CMS DUA 28643 The differential change (i.e., the between group difference in the change from the pre-contract period) in PMPY spending was almost -$110 per beneficiary in 2013 versus the comparison group. For 2014 performance year, differential change in PMPY spending was -$125 per beneficiary versus the comparison group. Finally, for the 2015 performance year, differential change in PMPY spending was -$117 per beneficiary versus the comparison group. All the estimated results are statistically significant (p < 0.0001 for each estimate). Total spending reduction is calculated by multiplying per beneficiary per year savings (Table 2) with the number of person year beneficiaries in each performance year (Table 1). Following an as-treated measurement approach yields 99.994%21 of assigned beneficiaries in the calculation for each performance year. Estimated total spending reduction or savings is roughly $1.84 billion dollars over the three performance years. Table 3 shows total savings over time and in total for the MSSP ACOs, 2013-2015. Table 3: Total Savings Estimate Net CMS Shared Savings Payments
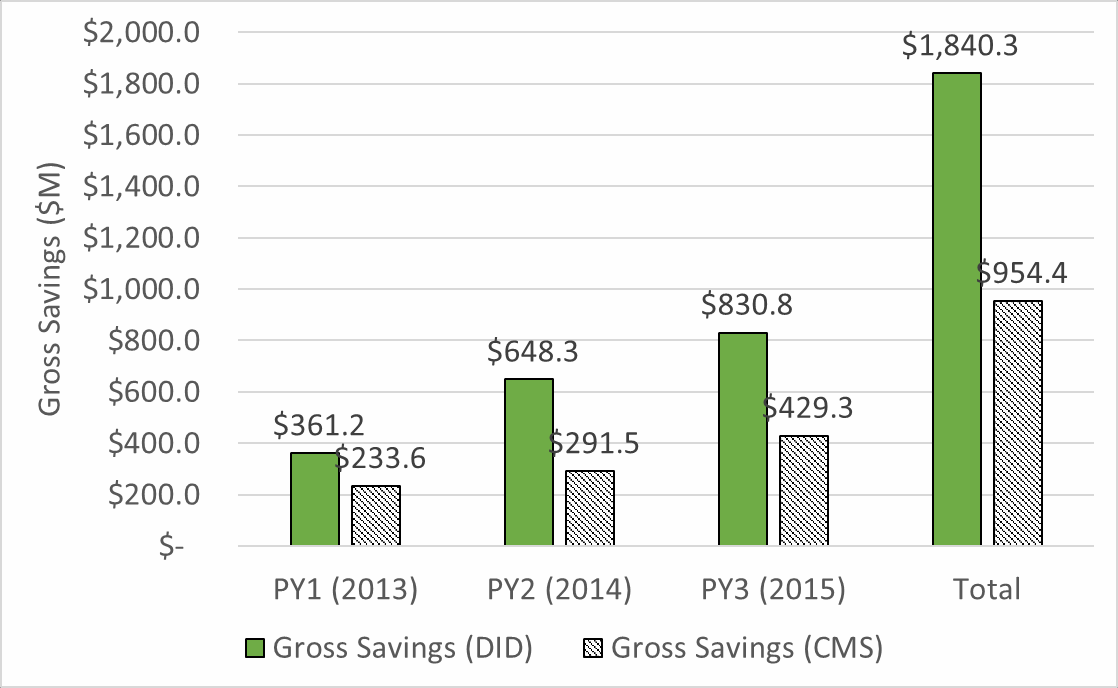
Source: Dobson | DaVanzo analysis of ACO RIF Data, CMS DUA 28643 Put in context, these savings are 1.1-1.2% of typical Medicare PMPY spending (about $10,331 PMPY for the average Medicare beneficiary in our database 2013-2015). By contrast, overall national Medicare per capita spending increased by 2.9% from 2013-201522. Our findings indicate ACOs savings represent a significant decrease in expenditure growth among ACO assigned beneficiaries compared to the expenditure growth of Medicare FFS overall. Indeed, we find substantially greater total gross savings than CMS for each performance year (Chart 1). CMS found $954.4M in savings 2013-2015 in comparison to our finding of $1,840.3M.Chart 1: Comparison of CMS and Dobson | DaVanzo (D|D) Gross Savings Estimates
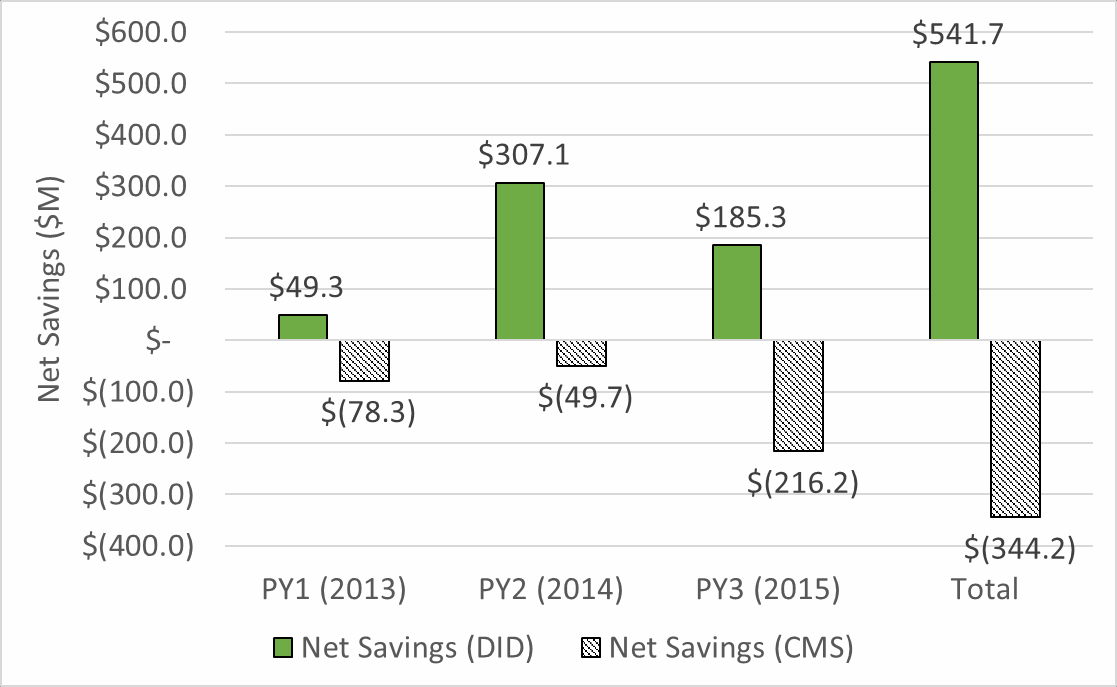
Source: Dobson | DaVanzo analysis of ACO RIF Data, CMS DUA 28643 and CMS MSSP Public Use Files, 2013-2015 CMS rewards high-performing ACOs by returning a portion of savings (or losses) for ACOs that generate savings and meet reporting and quality requirements. Although MSSP is a CMS Alternative Payment Model, most ACOs do not currently face downside risk (i.e. the possibility of owing losses to CMS to account for losses under 2-sided risk approaches). We removed CMS incentive payments (and fees) from the gross savings levels to calculate net outlays for CMS in Chart 2. Where CMS reports negative savings to the Medicare Trust Fund in all performance years 2013-2015, we find substantially higher gross savings and positive net savings in 2013-2015 as well as overall. We found MSSP has generated $541.7M in net savings 2013-2015, compared to the CMS benchmark calculation that suggest increased spending of -$344.2M. Chart 2: Comparison of CMS and Dobson | DaVanzo (D|D) Net Savings Estimates (Gross savings less CMS shared savings payments)23
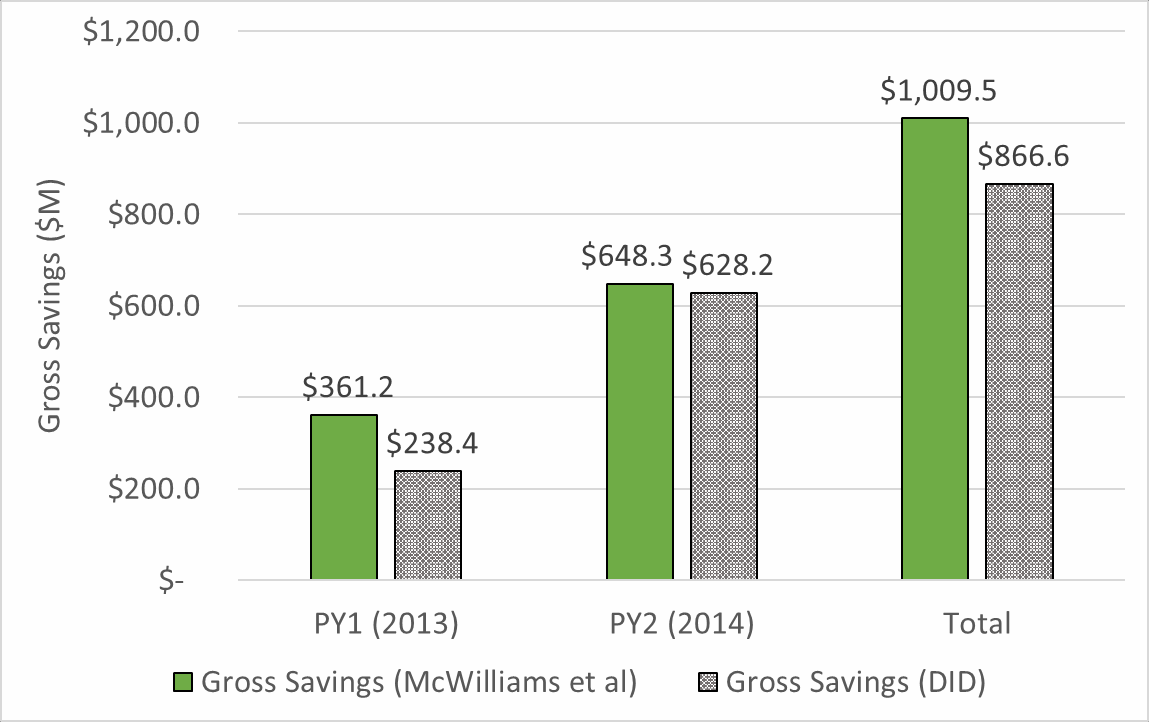
Source: Dobson | DaVanzo analysis of ACO RIF Data, CMS DUA 28643 and CMS MSSP Public Use Files, 2013-2015 Discussion As CMS and other payers implement new payment models they need methods to set spending targets and calculate rewards and penalties for participating providers based on their performance. Benchmarks and other types of spending targets are required to administer new payment models but produce results that differ from research-based evaluations.24 As a case in point, our analysis of gross ACO savings using difference-in-differences regression estimated 2013-2015 MSSP ACO savings of nearly double the amount derived from CMS’ benchmark calculations. Other researchers have determined that CMS use of benchmarks systematically underestimates ACO savings.25 This occurs for several reasons. First, ACOs are disproportionally located in geographic areas with high Medicare spending growth but ACO benchmarks are updated annually based on the national average dollar growth in Medicare spending per beneficiary. Therefore, ACOs in high spending growth regions could exceed the CMS benchmark while outperforming other providers in its local market. Second, CMS caps the risk score for beneficiaries who are continually attributed to an ACO during each 3-year agreement period. This means that ACO benchmarks are not adjusted to reflect the increasing burden of illness as ACO beneficiaries age. Third, by reducing spending, ACOs also reduce the national rate of Medicare spending growth which further lowers the benchmarks used to measure ACO performance. We avoid these issues by comparing spending by ACO beneficiaries to a comparison group of ACO eligible, but not attributed beneficiaries matched geographically. We use difference-in-differences regression which allows us to control for a variety of secular trends including different rates of Medicare utilization and spending growth across geographic markets. Differences in risk, demographics or other issues are accounted for in a variety of beneficiary and geographic control variables. Comparison to McWilliams, et al. Savings Estimates The Dobson | Davanzo team difference-in-differences approach to measuring ACO savings was initially designed to approximate that of McWilliams, et al,26,27 a published, peer-reviewed evaluation which serves as an alternative to the CMS methodology. Similarly, McWilliams, et al. sought to provide an alternative evaluation methodology to CMS, employing a commonly accepted evaluation approach (a difference-in-differences design). As shown in Chart 3, we found somewhat greater savings than McWilliams et al., though savings were of a similar magnitude. Chart 3: Comparison of McWilliams et al and Dobson | DaVanzo (D|D) Gross Savings Estimates
Source: Dobson | DaVanzo analysis of ACO RIF Data, CMS DUA 28643 and McWilliams et al results 28 The overall design of the two studies is similar: both are claims-based retrospective studies with DID estimates taken for each performance year and MSSP cohort with adjustments made for patient characteristics and geographic variation in expenditure trends. Indeed, we make the same overall finding that MSSP generates net savings after earned shared savings and losses are apportioned. Major differences between the two studies arise in terms of:
o McWilliams et al. approach is somewhat different. Unattributed beneficiaries are assigned to non-ACO TINs to create a counterfactual via the ACO assignment methodology. ACO TINs are compared to counterfactual TINs within a hospital referral region. The studies also differ in more subtle ways, such as the specific regression adjustors used, the length of the pre- and post-period, etc. It is unclear whether the groups used different procedures in treating expenditures as this level of detail is not typically included in published articles. In our estimation, the approaches are quite similar and should offer comparable results as they do. Study Limitations This study has several notable limitations. First, by using an as-treated design, we do not capture savings spillover and other market effects that may be brought on by MSSP.29 As such, we likely underestimate savings. Next, this study used administrative claims data which has well-described drawbacks such as known completeness and diagnostic representativeness issues. That said, the study database here is very powerful and built for the purpose of this study – CMS provided beneficiary flags to identify beneficiaries who had been assigned to ACOs. We will note that here assignment is used as an approximation for having been treated by the ACO – though assignment requires that a beneficiary has received at least a primary care visit (or similar service) with ACO participant providers, it does not guarantee the ACO had a substantial impact on their service utilization. An additional limitation is that we did not have beneficiary category eligibility by beneficiary month as used to construct MSSP benchmarks, expenditures and other measures. Though we were able to benchmark total ACO expenditures to the MSSP public use file, per category spending as well as truncation and annualization procedures are affected. This issue is solved in newer versions of the Master Beneficiary Summary File A/B/C/D segment, though this data was not available for use in these study years at the time of study initiation. Appendix: Database Specifications Data Source – Research Identifiable Files (RIF):
Data Source (for geographic location factor Hospital Referral Region (HRR)):
Database Construction The unit of observation of the regression database is patient level. The database includes information on both ACO assigned beneficiaries and unattributed beneficiaries (assignable beneficiaries). The database includes per member per year (PMPY) expenditures, patient level demographic information (age, gender, and race, Medicare dual eligibility) and health status or severity of beneficiary risk (Hierarchical Condition Category (HCC) scores), as well as whether beneficiary has end-stage renal disease (ESRD) and whether disability is the original reason for Medicare eligibility. We have also included geographic location factors like counties and HRRs corresponding to each beneficiary. We have constructed PMPY expenditures using all seven care setting files (Outpatient, Inpatient, Physician, HHA, SNF, DME, Hospice) and ACO beneficiary level and provider RIF files and the Master Beneficiary Summary file. As a quality check, we have compared ACO level PMPY expenditures with ACO level public use files (PUFs). Section B describes the detailed methodology on PMPY expenditures calculation. We have compared ACO level demographic information with ACO level PUF files for quality check. Following table (Appendix Table 1) shows the comparison of PMPY spending between ACO PUF and RIF calculation: Appendix Table 1: Benchmarking PMPY spending from RIF with ACO PUF
Source: Dobson | DaVanzo analysis of ACO RIF Data, CMS DUA 28643 and CMS MSSP Public Use Files, 2013-2015 Detailed description on demographic variables construction is given in section A. Using version 22 CMS-HCC Risk adjustment model, we have calculated HCC scores at patient level for each year. We have used CMS’s 2014 model software to calculate HCC scores for each year. Finally, using the Dartmouth Atlas of Healthcare Website, we have used the zip code and HRR cross walk information in each year and incorporated it in our database. We have created HRR dummy variables in our database. We have also constructed year dummy variable and the interaction between year and HRR dummy variables. To design pre and post period database for regression analysis we have pulled data from 2011 to 2015. The post contract period depends on the ACO performance year and when beneficiaries were assigned to that ACO. For example, for an individual who is assigned to an ACO in 2013, the post periods are 2013, 2014, 2015. Similarly, for an individual who is assigned to an ACO in 2015, the post period is 2015. Since the ACOs start in two different periods in 2012 (April 1st and July 1st), we have considered 2012 as a neutral period for those beneficiaries who joined the ACOs in 2012. We have constructed dummy variables called “Aftert” to indicate the pre and post period for a beneficiary. We have also constructed a dummy variable called “Treatit” to indicate treatment versus comparison group beneficiaries. The treatment group includes all assigned ACO beneficiaries and the comparison group includes the unattributed (ACO eligible) beneficiaries from the counties from where the ACO assigned beneficiaries reside. If we observe that corresponding to a specific performance year, any county consists of less than 5 ACO assigned beneficiaries, beneficiaries residing in that county were excluded from our final database. Since beneficiaries may join or exit the program in different time periods, we have restricted our comparison group to only those beneficiaries who were never assigned to an ACO. The following sections describe the specification for demography and expenditure variables construction. Demography Variables
Per Member per Year (PMPY) Expenditure Calculation
Annualization: After summing a beneficiary’s expenditure for all care settings (Physicians, SNF, Inpatient, Outpatient, HHA, DME and Hospice), we annualize the expenditures by dividing them (claim payment amounts) by the fraction of months in the year each beneficiary was enrolled in each Medicare enrollment type. In other words, to annualize a beneficiary’s expenditures, we divide the total expenditures in the applicable months by the fraction of the year the beneficiary is enrolled. Truncation: In order to prevent a small number of extremely costly beneficiaries from significantly affecting the ACO’s per capita expenditures we have truncated the annualized expenditures at beneficiary level for each care-setting. We have truncated the expenditures at 99th percentiles after annualization. We have done it at both end (upper bound and lower bound). Appendix Table 2 shows exclusion and inclusion criterion following MSSP methodology.30 Appendix Table 2: Variables used in total beneficiary expenditure calculation
Note: Since from our RIF dataset, we do not have month of eligibility information by four types of beneficiary categories (Ages-dual, Aged-non-dual, disabled and ESRD), we do not calculate the PMPY spending for these four categories and adjust the PMPY spending calculation by the weights of these beneficiaries. We have used all the above care setting files to calculate PMPY spending (after annualization and truncation). 1 CMS Medicare Shared Savings Program Fast Facts, January 2018. Retrieved https://www.cms.gov/Medicare/Medicare-Fee-for- Service-Payment/sharedsavingsprogram/Downloads/SSP-2018-Fast-Facts.pdf. 2 Medicare Program Shared Savings Accountable Care Organizations Have Shown Potential for Reducing Spending And Improving Quality. (2017, August). US Department Health and Human Services Office of Inspector General. Retrieved from https://oig.hhs.gov/oei/reports/oei-02-15-00450.pdf. 3 Medicare Program; Medicare Shared Savings Program; Accountable Care Organizations--Pathways to Success. 42 CFR Parts 414 and 425. Fed. Reg. August 2018. 4 Chernew ME, Barbey C, McWilliams JM. Savings Reported by CMS Do Not Measure True ACO Savings. Health Affairs Blog. June 19, 2017. 5 Medicare Payment Assessment Commission. Report to Congress. June 2018. 6 McWilliams, J. M. (2016, October). Changes n Medicare Shared Savings Program Savings From 2013 to 2014. JAMA, 316(16), 1711- 1713. Retrieved from https://jamanetwork.com/journals/jama/fullarticle/2552452. 7 McWilliams, J.M., et al. (2016, June). Early Performance of Accountable Care Organizations in Medicare. NEJM, 374, 2357-2366. 8 Comparison group beneficiaries were enrolled in Medicare Parts A & B and not Part C and had a primary care service (ACO eligible) but were not assigned to an ACO as they did not receive the plurality of primary care expenditures with an ACO. 9 Evaluation of CMMI Accountable Care Organization Initiatives: Pioneer ACO Evaluation Findings from Performance Years One and Two. (2015, March). Centers for Medicare and Medicaid Innovation. https://innovation.cms.gov/Files/reports/PioneerACOEval- Rpt2.pdf. 10 First Annual Report: Next Generation Accountable Care Organization (NGACO) Model Evaluation. (2018, January). Center for Medi- care and Medicaid Innovation. https://innovation.cms.gov/Files/reports/nextgenaco-firstannrpt.pdf. 11 Medicare Program Shared Savings Accountable Care Organizations Have Shown Potential for Reducing Spending and Improving Quality. (2017, August). US Department Health and Human Services Office of Inspector General. Retrieved from https://oig.hhs.gov/oei/reports/oei-02-15-00450.pdf. 12 Berwick, D. Launching Accountable Care Organizations — The Proposed Rule for the Medicare Shared Savings Pro- gram. NEJM, 364(32). 13 Difference-in-differences regression analysis was used to examine the effect of the MSSP ACO program on beneficiary spending relative to a comparison group, composed of beneficiaries not assigned to an ACO. 14 Evaluation of CMMI Accountable Care Organization Initiatives: Pioneer ACO Evaluation Findings from Performance Years One and Two. (2015, March). Centers for Medicare and Medicaid Innovation. https://innovation.cms.gov/Files/reports/PioneerACOEval- Rpt2.pdf. 15 First Annual Report: Next Generation Accountable Care Organization (NGACO) Model Evaluation. (2018, January). Center for Medi- care and Medicaid Innovation. https://innovation.cms.gov/Files/reports/nextgenaco-firstannrpt.pdf. 16 Medicare Program Shared Savings Accountable Care Organizations Have Shown Potential for Reducing Spending And Improving Quality. (2017, August). US Department Health and Human Services Office of Inspector General. Retrieved from https://oig.hhs.gov/oei/reports/oei-02-15-00450.pdf. 17 Evaluation of CMMI Accountable Care Organization Initiatives: Pioneer ACO Evaluation Findings from Performance Years One and Two. (2015, March). Centers for Medicare and Medicaid Innovation. https://innovation.cms.gov/Files/reports/PioneerACOEval- Rpt2.pdf. 18 First Annual Report: Next Generation Accountable Care Organization (NGACO) Model Evaluation. (2018, January). Center for Medi- care and Medicaid Innovation. https://innovation.cms.gov/Files/reports/nextgenaco-firstannrpt.pdf. 19 CMS Bundled Payments for Care Improvement Initiative Models 2-4: Year 3 Evaluation & Monitoring Annual Report. (2017, Octo- ber). Centers for Medicare & Medicaid Services. Retrieved from https://downloads.cms.gov/files/cmmi/bpci-models2-4yr3eval- rpt.pdf. 20 Medicaid 1115 Demonstrations Evaluation Design Plan, Design Supplement: Interim Outcome Evaluation June 2017. (2017, June). Centers for Medicaid & Medicare Services. Retrieved from https://www.medicaid.gov/medicaid/section-1115-demo/down- loads/evaluation-reports/eval-dsgn-dlvry-incntv-pymnts.pdf. 21 The file was a 99.994% match to the public use file benchmarks. 190-366 attributed beneficiaries were missing per ACO perfor- mance year (2013-2015). 22 Ibid. 23 Note that CMS shared savings payments to ACOs were removed from gross savings findings to find net programmatic impact (mar- ket impact less outlays). We did not simulate shared savings payment rules here for the alternative approach to measuring savings. 24 Delia D. Calculating Shared Savings: Administrative Formulas Versus Research-Based Evaluations. Health Affairs Blog. September 26, 2016. 25 Chernew ME, Barbey C, McWilliams JM. Savings Reported by CMS Do Not Measure True ACO Savings. Health Affairs Blog. June 19, 2017. 26 McWilliams, J.M., et al. (2016, June). Early Performance of Accountable Care Organizations in Medicare. NEJM, 374, 2357-2366. 27 McWilliams, J. M. (2016, October). Changes in Medicare Shared Savings Program Savings From 2013 to 2014. JAMA, 316(16), 1711-1713. Retrieved from https://jamanetwork.com/journals/jama/fullarticle/2552452. 28 McWilliams, J. M. (2016, October). Changes in Medicare Shared Savings Program Savings From 2013 to 2014. JAMA, 316(16), 1711-1713. Retrieved from https://jamanetwork.com/journals/jama/fullarticle/2552452. 29 Medicare Program Shared Savings Accountable Care Organizations Have Shown Potential for Reducing Spending And Improving Quality. (2017, August). US Department Health and Human Services Office of Inspector General. Retrieved from https://oig.hhs.gov/oei/reports/oei-02-15-00450.pdf 30 https://www.cms.gov/Medicare/Medicare-Fee-for-Service-Payment/sharedsavingsprogram/Downloads/Shared-Savings-Losses- Assignment-Spec-v2.pdf. |
|||||||||||||||||||||||||||||||||||||||||||||||||||||||||||||||||||||||||||||||||||||||||||||||||||||||||||||||||||||||||||||||||||||||||||||||||||||||||||||||||||||||||||||||||||||||||||||||||||||||||||||||||||||||||||||||||||||||||||||||||||||||||||||||||||||||||||||||||||||||||||||||||||||||||||||||||||||||||||||||||||||||||||||||||||||||||||||||||||||||||