Download as PDF A Look at MSSP ACO Performance Years 1 – 3September 2016IntroductionOn August 25, 2016, the Centers for Medicare & Medicaid Services (CMS) released the 2015 performance data for Accountable Care Organizations (ACOs) in the Medicare Shared Savings Program (MSSP). These results provide an important look at early trends for one of Medicare’s premier alternative payment models (APMs) and for individual ACOs, which are still developing and gaining experience in the program. ACOs represent a new approach to the delivery of health care and were created through a bipartisan effort to facilitate coordination and cooperation among providers to improve the quality of care and reduce unnecessary costs. The following report provides a deeper analysis looking at the MSSP ACO public use files (PUF) released for each performance year (2013–2015). This report includes three sections: (1) 2015 Performance Year 3 results by cohort start year, (2) a comparison of the results from each of the three performance years, and (3) potential success factors for ACOs in the 2015 Performance Year 3 results. The first two sections cover both quality and financial aspects of the MSSP ACO program. The challenge of changing numbersEach year, CMS releases the MSSP ACO performance year results with slightly different term definitions, usage, and formats. This makes an apple to apples comparison across years challenging at best. Some issues to note include significant differences between the results found in the PUFs and those provided in CMS’s press releases and fact sheets. Some of these challenges include:
The press releases and fact sheets provided by CMS are not updated after their initial release, and these static numbers likely represent the best information available on the day of the press release. In contrast, the PUF tables are updated periodically and the results can differ depending on when you download the file. This means that validating numbers across platforms (press releases to PUFs) and across different download dates is a challenge. To address this, the PUF tables for Performance Years 1 – 3 used in this analysis were all downloaded on August 30, 2016, and the hyperlinks to the data sources are provided for each table and graph.
There are two standard PUF tables that accompany each performance year results. The first is typically released on the same day as the press release and represents a subset of information. Approximately a month after the press release, a second and more comprehensive PUF is released. The exact components differ each year, but this later file often includes important variables, such as the assigned beneficiary person-years, which are needed in order to calculate per capita related analysis. The findings in this report represent data calculated using the 2013–2015 MSSP ACO PUF tables, downloaded on August 30, 2016. The challenge of different terminologySome of the most discussed components of the ACO performance year results include the savings categories of generated, earned, and the net savings to Medicare Trust Fund, which are all commonly used and commonly confused variables. The difference between the press release and the PUF tables can be even more challenging to cross reference, when terms and specifications are not consistently used across platforms or years. As an example, the term “shared savings” has multiple definitions, where some may refer to the ACOs net savings, as CMS did in the recent press release, while others refer to the generated savings or earned savings, as CMS did in past press releases. To complicate things further, the PUF dictionaries and methodology specifications have not been released yet, making it impossible to fully validate some of the 2015 results at this time. According to CMS’s latest Performance Year Dictionary (provided in the 2014 PUF “About” section):
In this year’s CMS press release, CMS did not provide the Medicare Trust Fund amount. However, in reviewing and replicating previous performance year press releases and results, the below provides how the Medicare Trust Fund can be calculated.
Note: The Medicare Trust Fund calculation represents a subset of MSSP ACOs, looking at those that met or exceeded their benchmark and MSR. It does not include those that did not meet their MSR but did meet or exceed their benchmark. However, the above saving categories represent only ACOs that met or exceeded both their benchmark as well as their MSR. Not included in the above categories are those ACOs that beat their benchmark but were below their MSR, and yet this second group of ACOs are still providing a positive contribution to the program. In order to provide a more balanced view, the following definitions provide a more comprehensive look at savings to CMS. Since there are not official terms for these variables, we are using the following for this report:
Section 1:Performance Year 3 (2015) results, by cohortThe first section of the report looks at the 2015 Performance Year 3 results for MSSP ACOs, stratified by when the ACO started in the program. Stratifying by ACO start year provides a better understanding of whether length of time or experience makes a difference to the quality, costs, or savings of an ACO. Ideally, per capita would be calculated to provide an “apples to apples” comparison across cohorts; however, the variable needed for that calculation, Total Assigned Person Years, has not yet been released for the Performance Year 3 results. Table 1 provides descriptive information on the ACO cohorts. The number and size of the ACOs range fairly evenly across the four start years, with each cohort ranging between 89 and 112 ACOs and the number of beneficiaries ranging from 1,648,365 to 2,055,926 patients. Differences can be found in ACOs that participated in Track 2 and advanced payments, with the 2012 and 2013 start years representing the only cohorts with Track 2 participating ACOs and those that received advanced payments. Table 1: Descriptive information about the MSSP ACOs represented in Performance Year 3 (2015) by ACO start year. Data source: 2015 PUF data.
As seen in Table 2, the overall quality results from Performance Year 3 are impressive at 91.4 percent. When looking across cohort years, the variation in quality score ranges between the lowest at 90.4 percent among the 2013 cohort and 92.6 percent among the 2014 ACOs. The number of ACOs that met the quality standards is high across all cohort years, with all but seven ACOs meeting quality standards. First year ACOs are evaluated under Pay for Reporting (P4R), which evaluates quality performance based on complete and accurate reporting and is used to phase starting ACOs into pay for performance. Table 2: Quality information about the MSSP ACOs represented in Performance Year 3 (2015) by ACO start year. Data source: 2015 PUF data.
Table 3 breaks down the expected (total benchmark expenditures) and actual costs (total expenditures) by each cohort year. The differences between the expected and actual costs are provided in total dollar amount (total benchmark minus assigned beneficiary expenditures) and percent of total benchmark (total benchmark minus assigned beneficiary expenditures as a percent of total benchmark). The differences between cohort years can be easily seen in the percent of total benchmark row, with the lowest -0.18 percent (2014) and highest at 1.55 percent (2013). Table 3: Benchmark and assigned beneficiary expenditure information in Performance Year 3 (2015) for all ACOs by ACO start year. Data source: 2015 PUF data.
As seen in Table 4, ACOs were split into those that were below and those that were above their benchmarks, as well as the difference between the two ACO groups. The difference between those that were below and above the benchmarks can be found in the bottom row. ACOs that started in 2012 received the highest the largest net outcome, with $405 million. Whereas younger ACOs that started in 2014 received a negative net amount of -$52 million. The strong financial performance of the oldest cohort of ACOs in 2012 demonstrate the potential of the MSSP program to provide savings and even offset some of the losses of younger ACOs in the program. Table 4: Benchmark and assigned beneficiary expenditure information in Performance Year 3 (2015) by ACO start year. Data source: 2015 PUF data.
As seen in table 5, the differences found across ACO start years is striking. Comparing the oldest and newest ACO cohorts, twice as many (42 percent) ACOs that generated and earned savings are represented in the more experienced 2012 cohort compared to half as many (21 percent) in the newer 2015 cohort. The same difference is found in the total net savings to the Medicare Trust Fund for ACOs that met or exceeded their MSR, with the 2012 cohort alone representing 48 percent of the Trust Fund contribution across all start years. Table 5: Generated and earned savings information in Performance Year 3 (2015) for ACOs who equaled or exceeded their benchmark and MSR by ACO start year. Data source: 2015 PUF data.
* Note: The Medicare Trust Fund is terminology used by CMS and represents a subset of MSSP ACOs, looking at those that met or exceeded their benchmark and MSR. It does not include those that did not meet their MSR but did meet or exceed their benchmark.
Section 2:Comparing Performance Years 1–3The second section of the report represents a comparison of Performance Years 1 through 3, which covers the years between 2012-2015. The Performance Year 1 data is unique in that it represents ACOs that started in April or July 2012 as well as those that started January 2013. The comparison of performance year results provides an important view into the evolution of the MSSP and if the program is improving over time. Table 6 provides descriptive information on the ACOs represented in each of the performance years. Between the first performance year and the last, the number of ACOs and the assigned beneficiaries has almost doubled (from 220 ACOs and 3.7 million assigned beneficiaries in 2012/2013 to 392 ACOs and 7.3 million assigned beneficiaries). Again, the same issue in the first section of this report is found here as well, where the Total Person-Years variable is not currently available for Performance Year 3, not allowing for per capita calculations. Also, the number of ACOs in Track 1 has increased over the performance years, yet the number participating in Track 2 and advanced payments declined slightly over the performance years. Table 6: Descriptive information about the MSSP ACOs represented in Performance Years 1–3 (2013–2015). Data sources: 2013 PUF data, 2014 PUF data, 2015 PUF data.
*The numbers for the 2012/2013 total person-years and total number of assigned beneficiaries are from the 2013 PUF zip file. Table 7 provides a look at quality across performance years. ACOs’ quality scores increase over eight percentage points from 2014 to 2015 (from 83.1 to 91.4 percent, respectively). Understandably, a decrease over time is found in the percentage of measures that ACOs improved on during the performance year compared to their baselines or previous years reporting. This makes sense because it is often more challenging to improve quality scores when starting out as a high performer at the start of the measurement year. Overall, the improvement in quality performance over the three measurement years is impressive. Table 7: Quality information about the MSSP ACOs represented in Performance Years 1–3 (2013–2015). Data sources: 2013 PUF data, 2014 PUF data, 2015 PUF data, 2015 Fact Sheet, 2014 Fact Sheet, 2013 Fact Sheet
*Performance Year 3 (2015) results include bonus quality points for ACOs who improved their quality score from Performance Year 2 (2014). Table 8 evaluates the total benchmark expenditures (the expected costs), the total expenditures (the actual costs), and the dollar and percentage difference across the three performance years. The costs increase over time, which is expected considering the growth of ACOs and assigned beneficiaries. However, percentage of the difference between the total benchmark and beneficiary expenditures shows steady growth over time. Table 8: Total benchmark expenditures and savings for the MSSP ACOs in Performance Years 1–3 (2013–2015). Data sources: 2013 PUF data, 2014 PUF data, 2015 PUF data.
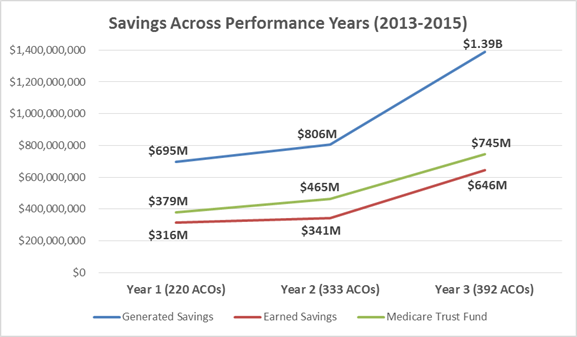
Table 9 evaluates the generated and earned savings and Medicare Trust Fund categories. Looking at the generated and earned savings, both the number and percentage of ACOs that met or exceeded the MSR represents strong growth over time. At the same time, the number of ACOs that generated savings but did not receive earned savings decreased over time, indicating improved adherence to the program requirements. The net savings from these ACOs to the Medicare Trust Fund also indicates slow, but steady growth over the performance years, from $379 million in 2012/2013 to $745 million in 2015. Table 9: Total savings for the MSSP ACOs in Performance Years 1–3 (2013–2015) for ACOs that met or exceeded their benchmark and MSR. Data sources: 2013 PUF data, 2014 PUF data, 2015 PUF data.
*The data for the 2013 generated savings amount and number of ACOs were taken from the 2013 PUF data, last updated November 7, 2014, since it was not available in the main 2013 PUF data, last updated on March 7, 2016. The earned savings amount and the number of ACOs were taken from the newer 2013 PUF data. ** Note: The Medicare Trust Fund is terminology used by CMS and represents a subset of MSSP ACOs, looking at those that met or exceeded their benchmark and MSR. It does not include those that did not meet their MSR but did meet or exceed their benchmark. Figure 1 on the next page provides another view of the information provided in Table 8. The blue line represents the generated savings among ACOs that met or exceeded their MSR, which indicates upward growth over the performance years. Similarly, the red line represents the earned savings, or the amount that ACOs actually received, and the green line represents the contribution to the Medicare Trust Fund from these ACOs. Both the earned savings and Trust Fund savings follow a similar improved growth over time. The gap between the earned savings to the ACOs and the Trust Fund widened in Performance Year 2 and slightly narrowed again in 2015. Figure 1: Generated, Earned and Medicare Trust Fund savings by MSSP ACO Performance Years (2013-2015). Data sources: 2013 PUF data, 2014 PUF data, 2015 PUF data.
*The data for the 2013 generated savings amount and number of ACOs were taken from the 2013 PUF data, last updated November 7, 2014, since it was not available in the main 2013 PUF data, last updated on March 7, 2016. The earned savings amount and the number of ACOs were taken from the newer 2013 PUF data. ** Note: The Medicare Trust Fund is terminology used by CMS and represents a subset of MSSP ACOs, looking at those that met or exceeded their benchmark and MSR. It does not include those that did not meet their MSR but did meet or exceed their benchmark.
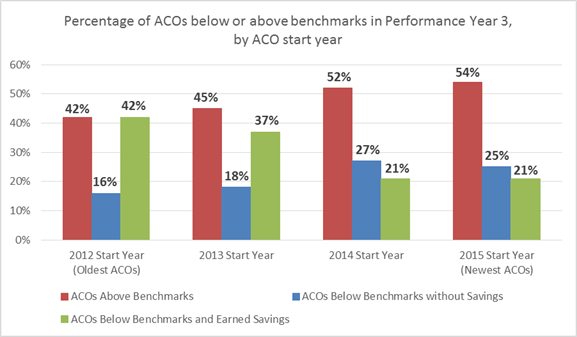
Section 3:Performance Year 3 and Potential Factors for SuccessThe third section of the report represents potential factors for success compared to benchmark performance for ACOs that participated in the MSSP in 2015. Stratifying ACOs by various characteristics, such as start year, ownership status, number of assigned beneficiaries, or ACO location, provides insight into areas that may, or may not, support ACOs meeting or exceeding their benchmarks. The following tables include a final column that shows the difference between the benchmark (expected costs) and the assigned beneficiary expenditures (actual costs) as a percentage of the total benchmark, with positive percentages in green and negative percentages in red. The colors provide a quick view of those factors with a financial positive or negative impact. Table 10 looks at ACOs by start year and the percentage of ACOs that were above and below their benchmarks, as well as those that were below benchmarks and earned shared savings. As found in other ACO start year tables in this report, older ACOs in 2012 and 2013 have higher percentages of their cohorts earned shared savings, compared to younger ACOs in 2014 and 2015. Similarly, the difference of the benchmark and expenditures found positive percentages in 2012 and 2013 and negative percentages in younger ACOs. Table 10: Benchmark performance by ACO start year for MSSP ACOs in Performance Year 3 (2015). Data sources: 2015 PUF data.
*Difference between benchmark (expected costs) and assigned beneficiary expenditures (actual costs) as a percentage of total benchmark, positive percentages in green and negative percentages in red. The data found in Table 10 above is visually presented in Figure 2 below. The red bars represent the percentage of ACOs that were above their benchmarks, with the percentage of each cohort slightly decreasing from newer to older ACOs. The blue bars represent ACOs that were above their benchmark but did not earn shared savings and, interestingly, almost mirrors the red bar’s course, albeit with lower percentages. The green bars represent the percentage of ACOs that were below their benchmark and earned savings, representing strong improvement for older ACOs in 2012 and 2013 start years. Figure 2: Benchmark performance by ACO start year for MSSP ACOs in Performance Year 3 (2015). Data sources: 2015 PUF data.
Table 11 on the next page shows benchmark performance for three types of ownership status: Physician owned (comprised of independent physician participants), hybrid ownership (comprised of independent physicians, hospital facilities and may include employed physician participants), or health system owned (comprised of a health system as prime owner and includes facilities and employed physician participants). Similar results were found across each of the three categories, with each group representing roughly half of the ACOs that were above their benchmark. All three categories also have positive percentages in the benchmark minus expenditure calculation, though physician owned ACOs indicate more positive outcomes (1.08 percent) than the hybrid and health system owned ACOs (0.30 percent and 0.10 percent, respectively). Table 11: Benchmark performance by ACO ownership status for MSSP ACOs in Performance Year 3 (2015). Data sources: 2015 PUF data.
*Difference between benchmark (expected costs) and assigned beneficiary expenditures (actual costs) as a percentage of total benchmark, positive percentages in green and negative percentages in red. Table 12 on the next page looks at benchmark performance with the size of the ACOs assigned beneficiaries, with group sizes selected for four equally sized groups. Interestingly, the smaller ACOs with 12,545 beneficiaries or less represent a positive difference between benchmark and expenditures percentage and over a third of the ACOs earned shared savings. In fact, the smallest group (under 7,971 beneficiaries) has a positive 2.3 percentage difference between benchmark and expenditures, and 42 percent of the ACOs earned shared savings. This finding could indicate that ACOs with smaller populations fair better than those that may be taking on larger populations. These data lead to a number of hypotheses to be explored in further analysis. For example, care coordination and other improvement activities represent restructuring care pathways that can take time and are complicated to roll out. Smaller population size also allows for greater physician engagement, ideal for improvement initiatives. Table 12: Benchmark performance by ACO size for MSSP ACOs in Performance Year 3 (2015). Data sources: 2015 PUF data.
*Difference between benchmark (expected costs) and assigned beneficiary expenditures (actual costs) as a percentage of total benchmark, positive percentages in green and negative percentages in red. Table 13 looks at benchmark expenditures per assigned beneficiary. The results clearly show that those ACOs spending more money per beneficiary ($9,863 and more) compared to those spending less than $9,863 have a higher percentage of ACOs earning shared savings and have a positive benchmark minus expenditure percentage. In fact, almost half (49 percent) of ACOs that spent over $11,352 per beneficiary earned shared savings. Note: Since the ideal variable for cost per person, beneficiary person-years, has not yet been released, the following table should be considered as an estimate of costs. Table 13: Benchmark performance by ACO expenditure per beneficiary (not beneficiary years) for MSSP ACOs in Performance Year 3 (2015). Data sources: 2015 PUF data.
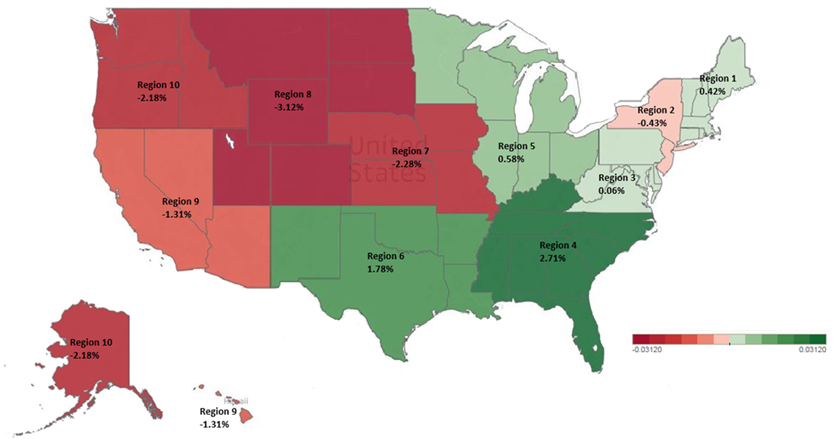
*Difference between benchmark (expected costs) and assigned beneficiary expenditures (actual costs) as a percentage of total benchmark, positive percentages in green and negative percentages in red. Table 14 looks at regional variation on benchmark performance. The CMS Region 4, which includes states in the southern United States (Alabama, Florida, Georgia, Kentucky, Mississippi, North Carolina, South Carolina, and Tennessee), had almost half (46 percent) of ACOs earn shared savings and had a positive 2.71 percent difference between benchmark and expenditures. Other regions with positive results include other southern states as well as states in the central and eastern United States (CMS regions 1 and 3-6). On the other hand, CMS regions 2 and 7-10, largely states in the western United States, had low percentages of ACOs that earned shared savings and negative percentage difference between benchmark and expenditures. Note: Some ACOs are represented in multiple states and sometimes multiple regions. To capture the variation, a few ACOs are represented in more than one geographical region. Table 14: Benchmark performance by ACO geographical CMS region for MSSP ACOs in Performance Year 3 (2015). Data sources: 2015 PUF data.
*Difference between benchmark (expected costs) and assigned beneficiary expenditures (actual costs) as a percentage of total benchmark, positive percentages in green and negative percentages in red. The data found in Table 14 above is visually presented in Figure 3 below. The map illustrates the distinct difference between the regions with positive percentages (colored green) and those with negative percentages (colored red). The southern states represented in CMS Region 4 had the highest positive difference between benchmark and expenditures at 2.71 percent. Adversely, the states represented in CMS region 8 had the highest negative difference between benchmark and expenditures at -3.12 percent. Figure 3: Total Benchmark Minus Assigned Beneficiary Expenditures as a percentage of Total Benchmark by ACO CMS regions for MSSP ACOs in Performance Year 3 (2015). Data sources: 2015 PUF data.
Closing Thoughts In terms of shared savings during the initial three performance years, the financial results are somewhat less impressive than NAACOS originally hoped. However, ACO performance during these early years reflects a number of positives elements as well as signs for a promising future for the ACO model, provided CMS implements some programmatic changes advocated for by ACOs. One positive example of these results is ACOs that began the program in 2012 were collectively $405 million below their benchmarks for Performance Year 3 (2015). These positive results for early starters indicate that, not surprisingly, ACO performance tends to improve the longer ACOs are in the program. These ACOs have made considerable investments (our recent survey shows approximately $1.6 million annually) to change how care is delivered, including investments in care coordination and care improvement initiatives, health information technology and other population health management initiatives, in order to benefit patients. The incentive for many of these providers to continue these types of investments is directly tied to their participation in the MSSP. Further, successful ACOs rely on their shared savings payments from CMS to maintain and establish new population health initiatives, thus reinforcing their ability to improve patient care, lower unnecessary costs and utilization, and generate savings for Medicare and themselves. The success of early ACOs did not happen overnight —it has taken these ACOs years to see improvements. As we pause to evaluate the 2015 performance results, it is critical to recognize that an ACO’s learning curve and initial investments should be amortized over years. Change doesn’t happen overnight, especially that which involves large, complex organizations in an industry heavily regulated by government with a challenging task of caring for a diverse and aging Medicare patient population. We strongly encourage those evaluating the success of the ACO program to allow time for these investments and changes to take hold in order to evaluate the ACO model properly. Although the transition from fee-for-service to population-based models can take years, we are already seeing the benefits. In addition to savings, especially from the initial cohort of ACOs, there has been improved quality, one of the key benefits of the ACO program. These quality improvements have added value in the short term for Medicare beneficiaries and will hopefully continue to improve over time. There is also a benefit from the spillover effect from ACOs’ investments and efforts to redesign care delivery to improve beneficiary health. ACOs undertake these efforts for Medicare patients, but their care redesign efforts also benefit patients covered by other payers —almost all of whom will be covered by Medicare later in life. This benefit is acknowledged in the commercial health insurance sector as commercial payers increasingly recognize the value these ACOs bring and develop their own commercial ACO arrangements. Lastly, there are some existing program defects in the MSSP methodologies that make it even more difficult for ACOs to achieve “success,” as defined by CMS’s calculations of savings. CMS has acknowledged shortcomings of certain methodologies and continues to refine them through regulatory changes. For example, earlier this year CMS finalized a number of changes to the MSSP benchmarking methodology. These changes will be phased in starting with performance year 2017 and therefore are not reflected in the 2015 performance results. One of the most notable changes to the benchmarking methodology is that CMS will gradually begin to compare ACO expenditures to those in the ACO’s region. This revised approach means that ACOs will no longer be evaluated solely on their ability to continuously beat their past performance, which is particularly challenging for efficient ACOs that entered the program with low costs. Rather, ACOs will be increasingly compared relative to providers in their regions, an approach which according to our analysis will enhance the ability of approximately 2/3 of ACOs to achieve success. While we are pleased to see changes to the benchmarking methodology, there are a number of other programmatic changes needed to ensure the long-term sustainability of the Medicare ACO program. For example, risk adjustment continues to be a significant issue for MSSP ACOs since risk scores do not increase year to year during an agreement period for continuously assigned beneficiaries, regardless of beneficiary changes in health status. Although ACO risk scores are capped on the upside, if risk scores go down based on improvements in beneficiary health, so too does the ACO’s benchmark which makes it harder to beat in the future. This asymmetrical approach is unfair to ACOs and different from other Medicare programs such as Medicare Advantage. ACOs are also increasingly affected by the overlap of competing CMS initiatives, such as bundled payment programs which make it harder for many ACOs to demonstrate savings. These two examples of challenges for ACOs can — and should be —remedied by CMS to secure the foundation of the ACO program. NAACOS continues to advocate for these and other program changes to enhance ACOs’ ability to succeed and continue their program participation. The bottom line is that this is a long journey and we should treat it as such. As illustrated in this report, ACOs do show promise, and patience and support will be essential in order to critically evaluate the long-term effect of the ACO model. Contact Information For more information, please contact Teresa Litton, MPH at [email protected] |
||||||||||||||||||||||||||||||||||||||||||||||||||||||||||||||||||||||||||||||||||||||||||||||||||||||||||||||||||||||||||||||||||||||||||||||||||||||||||||||||||||||||||||||||||||||||||||||||||||||||||||||||||||||||||||||||||||||||||||||||||||||||||||||||||||||||||||||||||||||||||||||||||||||||||||||||||||||||||||||||||||||||||||||||||||||||||||||||||||||||||||||||||||||||||||||||||||||||||||||||||||||||||||||||||||||||||||||||||