ACOs at a Crossroads: Costs, Risk and MACRA
Authors: Allison Brennan, Vice-President of Policy and Clif Gaus, President and CEO, National Association of ACOs |
|
Physicians |
Beneficiaries |
Cost per Beneficiary |
Total Benchmark |
Medical Group Gross Income |
Physician Income |
|
300 |
10,000 |
$10,000 |
$100,000,000 |
$10,000,000 |
$5,000,000 |
Under the first performance year of MSSP Track 2 (the lowest risk of any model for any year), an ACO is responsible for losses of up to five percent of its total benchmark, which increases to 10 percent by performance year three. Table 2 below illustrates how that translates into risk for the ACO owners. Therefore, under the smallest amount of risk in a Medicare two-sided risk model, CMS requires ACO physicians to be liable for an amount equivalent to their entire Medicare net income.
Table 2: ACO Owner Risk
|
Benchmark |
Year 1 Loss Sharing Limit |
Year 3 Loss Sharing Limit |
|
$100,000,000 |
$5,000,000 |
$10,000,000 |
Basing risk on total cost of care creates situations where physicians could be responsible for repaying a substantial amount, if not all, of their Medicare income, and such high risk in not feasible for the vast majority of ACO physician owners. The challenges of taking on risk are often exacerbated in rural areas where ACOs tend to have even fewer resources and may struggle to come up with start-up and investment costs, let alone be in a position to assume down-side risk. Even the promise of higher sharing rates or the ability to utilize waivers afforded to two-sided ACOs is not enough to overcome the barriers to assuming financial risk. Further, ACOs are in the business of delivering care and are not necessarily well equipped to take on what is essentially actuarial risk more typical of a health insurance company than a physician practice. Finally, while a slight majority of ACOs are physician owned, many others share ownership and financial responsibility with hospitals. The hospitals often have the same concerns about sharing in this level of risk as well.

ACO Risk Models: Survey Results on Two-Sided Risk
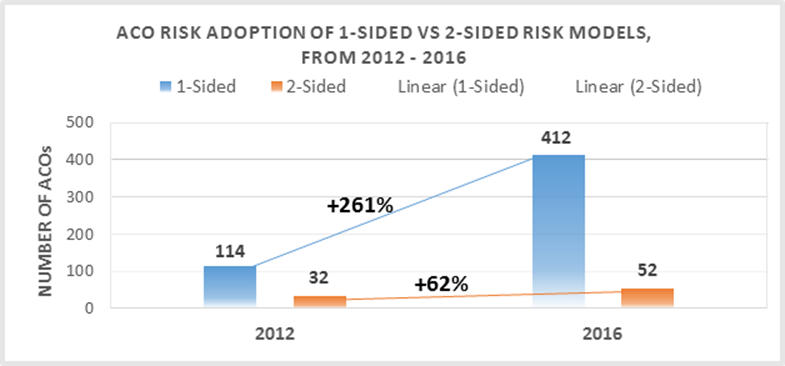
For ACOs to move successfully through the risk continuum, most begin with Track 1, in which about 90 percent of ACOs currently operate. It is a long, heavy lift for many ACOs to achieve success in Track 1 before they are ready to migrate into higher risk tracks. One of the goals of our recent NAACOS ACO Cost and MACRA Implementation Survey was to better understand ACOs’ willingness and ability to assume financial risk under a two-sided model. (Please refer to our comprehensive survey report for a full description of the survey methodology and findings.) All ACOs participating in the MSSP in 2015 and 2016 received an email with information about the survey, which includes ACOs that began the program as early as 2012.
One of the key takeaways from the survey is that ACOs are not currently prepared to take on the significant financial risk required in the current two-sided risk models. As seen in Figure 2 on the following page, when asked how likely the ACO is to continue participating in the MSSP if CMS requires downside risk, less than half (43 percent) said they definitely or likely will not continue in the MSSP. Twenty-one percent were unsure, and a third will definitely or likely continue to participate.
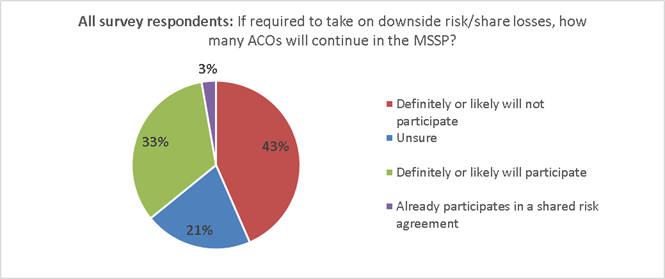
Figure 2: Survey response to “How likely is your ACO to participate in the MSSP if CMS requires ACOs to share losses?”
While many ACOs do not feel ready to take on risk now, most may be prepared to do so in the future. When asked how many years until an ACO is willing to take on downside risk, 84 percent said within the next six years (44 percent within 1-3 years and 40 percent within 4-6 years), as seen in Figure 3 below.
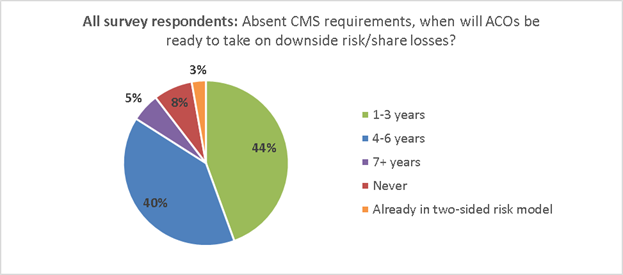
Figure 3: Survey repsonse to “Absent any CMS requirements to do so, indicate your best estimate for how many years it would be before your ACO would be willing to share losses.
While the data shows that a small portion of ACOs feel they will never be able to take on risk, it is promising that within six years, a large majority of ACOs believe they will be ready to move to two-sided models. However, this question did not ask about the specific level of risk in two-sided ACO risk models, and many survey respondents also commented that they are very concerned about the amount of risk required in the current Medicare two-sided models. As one survey respondent commented, “We would like to see a pathway to risk sharing that allows us to build the necessary reserves.”
ACO Costs and Investments
ACO Costs and Investments: Background and Issues
The majority of ACOs are reluctant to participate in two-sided risk models largely due to the financial risk required and the considerable investments in their ACO. Because these investments do not guarantee shared savings, ACOs view them as risk inherent in MSSP participation. These investments include start-up and operating costs. Our survey included questions about these costs, breaking them down into four categories detailed in Table 3 below.
Table 3: Survey responses to “Provide estimated marginal operating costs attributable to your participation in the MSSP.”
|
Estimated ACO Operating Costs: |
Total Averages: |
|
Clinical and care management |
$642,044 |
|
Health care information technology, population analytics, and reporting |
$501,300 |
|
ACO management, administration, financial, legal, and compliance |
$402,272 |
|
Other (sum or all other operating costs) |
$121,115 |
|
Total operational costs: |
$1,622,032 |
The survey respondents were broken into ACOs who are either independent entities or are part of a group with centralized operations and other shared services among many ACOs. These two groups were categorized as single ACOs or multi-ACOs respectively. Out of the survey respondents, 70 percent represent single ACOs and 30 percent represent multi-ACOs. Interestingly, the difference in operating costs between the single and multi-ACOs is almost half. The average cost of single ACOs is almost $2 million ($1,943,276), whereas the average cost of multi-ACOs is almost $1 million ($974,289) and the mean average for all survey respondents is between both of those amounts at $1,622,032. The range across all of the survey respondents is significant, ranging from as low as $185,000 to as much as $9,500,000.
In addition to the quantitative data survey respondents provided on costs, they also shared their feedback on these costs:
“We believe that there is considerable risk for ACOs that are participating in the one-sided model. The risk is inherent in the investments the ACOs are making in people to deliver the care/services to patients along with the technological and support costs that they may never see a return. If there never was participation in such an agreement these costs would not be incurred.”
“Our ACO is physician-owned and funded. Raising capital to develop our infrastructure has not been easy and comes at a substantial cost. Despite no downside risk from CMS, the risk of loss from personal investment is substantial.”
Despite repeated calls to do so, CMS unfortunately refuses to give ACOs credit for these investments or count them as financial risk. For example, in the May 9 MACRA Notice of Proposed Rule-Making (NPRM), the agency states:
“Many stakeholders commented that business risk should be sufficient to meet this financial risk criterion to be an Advanced APM. We also considered whether the substantial time and money commitments required by participation in certain APMs would be sufficient to meet this financial risk criterion. However, we believe that financial risk for monetary losses under an APM must be tied to performance under the model as opposed to indirect losses related to financial investments APM Entities may make. The amount of financial investment made by APM Entities may vary widely and may also be difficult to quantify, resulting in uncertainty regarding whether an APM Entity had exceeded the nominal amount required by statute.” (MACRA NPRM, 81 Fed. Reg. 89, May 9, 2016).
We understand the variability of these investments, which can be influenced by characteristics such as ACO size, structure, experience with population health payment models, or funding available to the ACO. However, based on our survey response rate of 33 percent of participating 2015 and 2016 ACOs, we feel confident in the average estimate of $1.6 million in annual operating costs. This figure also aligns with CMS’s own previous estimates. In the November 2011 Final ACO Rule, CMS stated:
“In order to participate in the program, we realize that there will be costs borne in building the organizational, financial and legal infrastructure that is required of an ACO as well as performing the tasks required (as discussed throughout the Preamble) of an eligible ACO, such as: Quality reporting, conducting patient surveys, and investment in infrastructure for effective care coordination.” (Final ACO Rule, 76 Fed. Reg. 212, November 2, 2011).
“Our cost estimates for purposes of this final rule reflect an average estimate of $0.58 million for the start-up investment costs and $1.27 million in ongoing annual operating costs for an ACO participant in the Shared Savings Program” (Final ACO Rule, 76 Fed. Reg. 212, November 2, 2011).
CMS based these estimates in part on those related to the Physician Group Practice (PGP) Demonstration, a precursor to the MSSP that ran from 2005 to 2010. In the November 2011 Final ACO Rule, CMS explained:
“An analysis produced by the Government Accountability Office (GAO) of first year total operating expenditures for participants of the Medicare PGP Demonstration varied greatly from $436,386 to $2,922,820 with the average for a physician group at $1,265,897 (Medicare Physician Payment: Care Coordination Programs Used in Demonstration Show Promise, but Wider Use of Payment Approach May Be Limited. GAO, February 2008)”. (Final ACO Rule, 76 Fed. Reg. 212, November 2, 2011) “We continue to believe that the structure, maturity, and thus associated costs represented by those participants in the Medicare PGP Demonstration are most likely to represent the majority of anticipated ACOs participating in the Shared Savings Program.” (Final ACO Rule, 76 Fed. Reg. 212, November 2, 2011)
When adjusting for inflation using the Department of Labor Consumer Price Index inflation calculator, the average estimate in the November 2011 Final ACO Rule for ACOs in the MSSP would be $1,350,867, and adjusting the GAO average estimate for PGP participants in the first year of that program, 2005, would result in $1,550,844. These estimates closely align with the results from our survey. With repeated estimates that provide similar results, it is difficult to see how CMS can continue to ignore these costs and not consider them as risk for the ACO.
ACOs and MACRA
CMS’s MACRA Proposal to Exclude Track 1 ACOs from Advanced APMs: Background and Issues
Passed in 2015, MACRA sets Medicare physician payment on a new course with two paths: one for providers in eligible APMs, and the other for those who do not meet the eligible APM criteria requires participation in the Merit-Based Incentive Payment System (MIPS). From 2019 through 2024, qualifying participants (QPs) in eligible APMs will earn annual lump sum bonuses of 5 percent (based on estimated aggregate payment amounts for covered professional services under the Medicare Physician Fee Schedule from the previous year). Beginning in 2026, the Medicare update factor for those in eligible APMs will be 0.75 percent annually, compared to a 0.25 percent for those in MIPS. The five percent APM bonus and 0.75 percent update amount are separate from any bonuses or penalties resulting from participation and performance in the specific eligible APM. MIPS has separate payment adjustments which begin in 2019 with maximum bonuses/penalties of four percent, which increase over time to nine percent beginning in 2022 and beyond.
MACRA defines an APM as any of the following:
- A model under the Center for Medicaid and Medicare Innovation (other than a health care innovation award)
- An MSSP ACO
- A demonstration under Section 1866C of the Social Security Act
- A demonstration required by federal law
As a subset of APMs, MACRA eligible APMs must meet the following criteria:
- Provide for payment for covered professional services based on quality measures comparable to those under MIPS
- Require use of certified electronic health records (EHRs)
- Bear more than nominal financial risk or be a medical home model
Those in eligible APMs must also meet thresholds based on a portion of Medicare payments or patients to qualify for the APM bonus. For example, in 2019 and 2020 at least 25 percent of Medicare payments must be attributable to services furnished to Medicare beneficiaries through an eligible APM or at least 20 percent of the APM’s patients must be attributed to the APM. These thresholds increase over time.
In the MACRA NPRM released in the Federal Register May 9, 2016, CMS proposes key details to implement APMs and MIPS. In the MACRA NPRM, CMS introduces the term “Advanced APM,” which the agency uses in place of “eligible APM,” as referred to in the MACRA statute. The departure from “eligible APM” to “Advanced APM” is notable because CMS raises the bar considerably with its definition of an Advanced APM, going much further than required by statute. In fact, CMS’s proposed criteria for what qualifies as an Advanced APM is so stringent that, if finalized, only six APMs would be considered Advanced APMs and earn the five percent eligible APM bonus. MSSP Tracks 2 and 3 and Next Generation ACOs are included on CMS’s proposed list of Advanced APMs, but Track 1 of the MSSP is excluded. The APM model (e.g., MSSP Track 3) is the Advanced APM and within the model, an individual participant (e.g., America ACO) is considered an Advanced APM Entity.
CMS’s proposal for what it means to “bear more than nominal financial risk” is at the heart of what determines whether an APM qualifies as an Advanced APM. CMS’s definition would require that if an Advanced APM Entity’s actual expenditures for which it is responsible exceed expected expenditures during a specified performance period, CMS can:
- Withhold payment for services to the APM Entity and/or the APM Entity’s eligible clinicians
- Reduce payment rates to the APM Entity and/or the APM Entity’s eligible clinicians or
- Require the APM Entity to owe payment(s) to CMS.
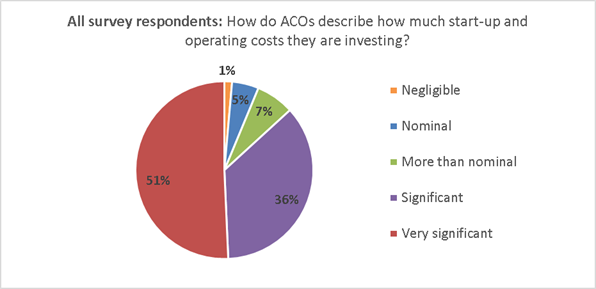
With this definition that excludes 90 percent of ACOs as Advanced APMs., CMS once again ignores the significant investments ACOs make to participate. While CMS continues to disregard these investments, ACOs argue their importance. In fact, when asked to describe their investments, over half (51 percent) of the respondents said that their ACO’s investment is “very significant,” as seen in Figure 4 on the following page.
Figure 4: Survey response to “Which word or phrase best describes your perspective regarding the investments your ACO has made (including both start-up and ongoing operating costs) to participate in the MSSP?”
Many survey respondents further elaborated on this, including this particular comment:
“We think the ACO is a good opportunity for us to transform how care is provided in our community to meet the health care needs of the future. We are all making significant sacrifices to put this organization together, both in personal finances and time. CMS needs to take into consideration the personal risks we are taking in addition to the definable financial risks.”

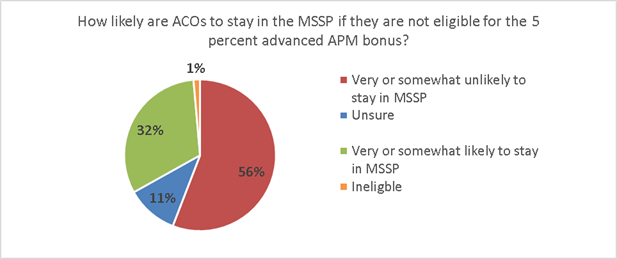
To better understand how ACOs may respond to MACRA and CMS’s approach to defining eligible or Advanced APMs, our survey asked how likely ACOs would be to stay in the MSSP if they are not eligible for the five percent Advanced APM bonus. As illustrated in Figure 5 below, 56 percent of the ACOs responded that they would leave the MSSP.
Figure 5: Survey repsonse to “How likely is it that your ACO would stay in the Medicare Shared Savings Program (MSSP) if Track 1 ACOs were not eligible for the APM 5 percent bonus?”
Overlap of ACOs and Bundled Payments
Bundled Payment Programs: Background and Issues
The prevalence of Medicare bundled payment programs has grown considerably in the last few years. In these models, hospitals, physician groups, or post-acute care providers bear financial risk for spending during an episode of care relative to a “target price,” often based on their historical spending for an episode minus a small discount, such as 2 or 3 percent. In an ideal world, there would be opportunities for both population-based payment models such as ACOs and bundled payment models to co-exist and even support one another. Unfortunately, in reality these models often compete with one another, and depending on how CMS chooses to address their overlap, that competition could harm ACOs and significantly weaken their ability to succeed as a payment model. Conflicts arise when patients attributed to an ACO are also evaluated under a bundled payment program. Under CMS policy, the bundled payment participant maintains financial responsibility for the bundled payment episode of care and any gains or losses during that episode are linked to the bundled payment participant and are removed from ACO results during year-end financial reconciliation.
The Medicare Bundled Payments for Care Improvement (BPCI) and the Comprehensive Care for Joint Replacement (CJR) Model are two premier CMS bundled payment programs. The BPCI initiative began in 2013 and, according to the CMS BPCI webpage, as of April 1 includes 1,522 participants. Under BPCI, participants elect to be paid a bundled price for up to 48 defined clinical episodes. There are four models within BPCI. The most popular are: (1) Model 2 with bundles that begin with a hospitalization and include all related services for up to 90 days after discharge and (2) Model 3 with bundles that begin with admission to a post-acute care facility or home health care. Total BPCI spending most likely exceeds $10 billion annually.
The CJR Model focuses on bundled payments to acute care hospitals for hip and knee replacement surgery, with an episode of care beginning when a Medicare fee-for-service beneficiary is admitted to a participant hospital and lasting through 90 days post-discharge. Notably, this bundled payment program is mandatory for hospitals in select geographic areas and is the first required program of this type and scale. CJR includes participant hospitals located in 67 Metropolitan Statistical Areas throughout the country. CMS indicates that approximately 800 hospitals will be required to participate in the model, which began April 1, 2016 and will run through 2020. CJR is expected to account for $2.5 billion to $3 billion in annual payments.
When CMS calculates an ACO’s shared savings, the spending for ACO patients with an episode of care provided by a bundled payment participant is set to that bundler’s target price, regardless of actual spending. Target prices based on higher cost baselines arbitrarily raise an ACO’s performance cost and removes their saving opportunity. However, certain ACOs can benefit from bundled payment program overlap if a bundle target price is lower than the ACO’s actual spending. While this impact may be favorable or unfavorable for a particular ACO depending on their costs relative to those of the bundler(s) in their market, the net effect skews accountability for population-based models and in general undermines ACOs’ opportunity for savings through care redesign since any savings would automatically go to the bundler. The problem is further exacerbated by the fact that the 60 to 90-day patient episode of care is carved out of the ACO’s provider network and there are no requirements for the bundler to transition the patient or their medical records back to the ACO to which they are assigned.CMS argues that prioritizing bundled payment programs helps assure adequate sample size for bundlers. However, much of the variation in per-episode spending is a result of utilization of post-acute care or readmissions, both of which ACOs are often instrumental in managing or preventing. ACOs focus on, and make considerable investments in, care coordination and improving care transitions to manage post-acute care effectively. Many successful ACOs credit these efforts for allowing them to achieve shared savings.
CMS does not provide opportunities for Medicare ACOs to formally share savings with bundlers, nor does the agency properly incentivize ACOs and bundlers to partner in coordinating beneficiary care. In fact, the rules guiding shared savings in the bundled payment programs specifically preclude an ACO from receiving payments for savings achieved in the bundled payment programs. While the agency encourages collaboration, it has not required it nor given proper incentives for bundled payment participants to enter into agreements with ACOs. Many ACOs report significant challenges negotiating arrangements with bundled payment participants, who have little incentive to do so. Unless bundled payment participants and ACOs sign collaborative agreements, ACO patients’ care should not be included in bundles. The overlap of these models also makes it very difficult to evaluate their separate outcomes, which will become increasingly important as CMS considers which models to expand and focus on in the future.

Summary of Policy Recommendations and Conclusion
The issues included in this white paper are of the utmost importance to ACOs, including those of today and the future. Addressing these challenges will not be easy but is essential to securing the foundation of Medicare ACOs. In summary, we urge CMS and the Administration to:
- Account for the significant investments ACOs make by including them in calculations of ACO risk,
- Address the growing evidence that the current two-sided ACO risk models are not attractive for most ACOs and set the bar much too high in terms of financial risk,
- Work closely with the ACO community to consider new approaches to risk that are more appropriate for the typical Medicare ACO,
- Finalize a list of Advanced APMs under MACRA that includes all Medicare ACOs, including those in MSSP Track 1,
- Remedy issues related to the overlap of Medicare bundled payment programs by prioritizing population-focused total cost of care models and exclude ACO beneficiaries from bundled payment programs unless a collaborative agreement exists between the bundler and ACO, and
- Clarify in regulation that even though ACOs are technically not providers, they are permitted to share in the savings from bundled payment programs where agreements with bundlers exist.
These recommendations reflect our expectation and desire to see Medicare ACOs achieve the long-term sustainability necessary to enhance care coordination for beneficiaries, lower the growth rate of health care spending, and improve quality in the Medicare program.
Appendix A: ACO Risk Structures
|
Downside Risk Element |
MSSP Track 1 (no downside risk) |
MSSP Track 2 |
MSSP Track 3 |
Next Generation ACO Model |
Pioneer ACO Model |
|
Minimum Savings Rate (MSR) /
Minimum Loss Rate (MLR) |
2.0% to 3.9% MSR depending on number of assigned beneficiaries
MLR not applicable to Track 1 ACOs |
Choice of a symmetrical MSR/MLR: no MSR/MLR; symmetrical MSR/MLR in 0.5% increments between 0.5% ‑ 2.0%; symmetrical MSR/MLR to vary based upon number of assigned beneficiaries (as in Track 1) |
Same as Track 2 |
Next Gen does not utilize MSRs/MLRs. Instead, CMS applies a discount to the benchmark once the baseline has been calculated, trended, and risk adjusted. Therefore, Next Gen ACOs can achieve first dollar savings for spending below the benchmark and are accountable for first dollar shared losses for spending above the benchmark. |
1% MSR/MLR (may be up to 2 to 2.7% for Pioneer ACOs in certain payment options) |
|
Shared Loss Rate |
Not applicable |
First dollar losses once MLR is met/exceeded. Shared loss rate may not be less than 40% or exceed 60%. |
First dollar losses once MLR is met/ exceeded. Shared loss rate may not be less than 40% or exceed 75%. |
First dollar shared losses for spending above the benchmark. |
First dollar losses once MLR is met/ exceeded. |
|
Loss Sharing Limit |
Not applicable |
Limit phases in over 3 years, starting at 5% in Year 1; 7.5% in Year 2; and 10% in Year 3 and subsequent years. |
15% |
15% |
Starts as low as 5% in Year 1 in two of the five payment arrangements. The other three start at 10%. All increase over time to 15% in Years 3-5. |
Suggested Citation: National Association of ACOs. (2016). ACOs at a Crossroads: Cost, Risk and MACRA White Paper. Available from www.naacos.com
