|
2016 Medicare ACO Results: Highlights In October, the Centers of Medicare & Medicaid Services (CMS) released results on Performance Year (PY 2016) for Medicare ACOs, including those in the Medicare Shared Savings Program (MSSP), the Next Generation Model, the Pioneer ACO program and the Comprehensive End Stage Renal Disease Care Model (CEC). These results are promising and demonstrate the significant value of accountable care models. The overall amount of savings and the proportion of those qualifying for earned shared savings reflects the deep commitment these organizations have for changing how care is delivered and demonstrates positive results for the beneficiaries they serve and for Medicare. This sends a strong message about the role of accountable care models and their significant contributions. The National Association of ACOs (NAACOS) is pleased to see that the hard work of ACOs continues to reduce spending while improving quality of care for millions of Medicare beneficiaries across the country. While this document includes highlights of the CMS results by focusing on the available data related to financial benchmarks and quality scores, it is important to note that those data points are just one way to look at ACO performance. Evaluating the “success” of the ACO program depends on how success is defined, and it’s important to not just look at ACO performance relative to CMS-manufactured benchmarks since it does not represent the true savings of the program. Skilled evaluators need to look beyond those benchmarks by comparing ACOs to providers not in ACOs, comparing ACO spending over time, and considering other effects of the program (e.g., spillover effects on the overall Medicare spending growth rate and effects on other programs such as Medicare Advantage or programs beyond Medicare). For more of this type of research on ACO performance, please refer to this NAACOS resource. Further, 2016 was the first year in which early ACOs, those who began in 2012 or 2013, had their benchmarks reset, i.e., rebased by CMS. Through that process, ACOs with previous savings had their benchmarks lowered as a result of those previous savings, which makes it harder for those ACOs to demonstrate savings and earn shared savings. ACOs generate and earn significant savings
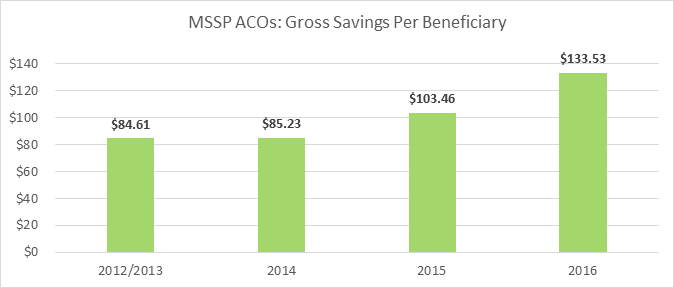
Graph 1: MSSP ACOs average savings per beneficiary, 2012-2016 performance years Note: the PY2013 Public Use File included expenditures for 2012 and 2013 but only included beneficiary attribution information for 2013; as such the PY2013 result is a proxy measure. ACOs provide very high quality for beneficiaries and improve quality over time
ACOs participating over a longer period show increased success
Physician-led ACOs generate substantial savings
Savings is significant in certain categories
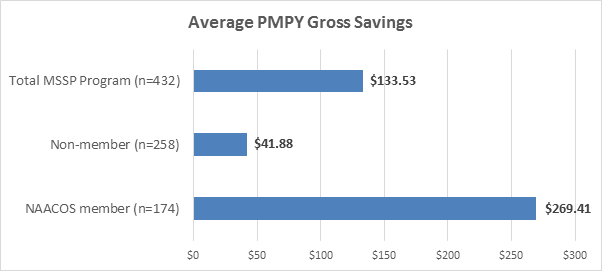
*Results are from the CMS webinar presented on October 19, 2017, slides can be found at: www.naacos.com/mssp Members of NAACOS perform better Across total net, earned and generated savings/losses, and average per member per year (PMPY) gross savings, members of NAACOS continue to lead the industry. If your ACO is not a member of NAACOS, please visit our website to learn more about the benefits of joining today!
|


